Software
The department has been closed following the retirment of Thomas Lengauer. Providing the software developed in the department has been discontinued. Some of the software is available at alternative sites, including;
ATTENTION - Data protection notice: All contact URLs lead to external websites.
Bilayout
BiLayout is a Java plugin for Cytoscape, a software platform for the analysis and visualization of molecular interaction networks. This plugin computes a bipartite network layout for 2 user-selected groups of nodes.
Contact
Epiexplorer

The EpiExplorer integrates multiple epigenetic and genetic annotations and |
Geno2pheno
Geno2pheno is a server that is freely accessible and that supports patient-specific analysis of viral resistance to drugs and ranking of combination drug therapies with respect to their effectiveness. The pathogens covered by the server are HIV, HBV and HCV. A dozen analyses are offered. All analyses are based on the viral genotype. For some analyses additional information on clinical parameters of the patient and/or on patient history can be added. Predictions are based partly on rule sets hand-crafted by medical experts, and partly on models trained on resistance data with statistical learning methods.
Reference: Lengauer, T. and T. Sing, Bioinformatics-assisted anti-HIV therapy. Nat Rev Microbiol, 2006. 4(10): p. 790-7.
Lengauer, T., et al., Bioinformatics prediction of HIV coreceptor usage. Nat Biotechnol, 2007. 25(12): p. 1407-10.
NetworkAnalyzer
NetworkAnalyzer works as Java plugin for Cytoscape, a free open-source software platform for visualization and analysis of biomolecular networks. This plugin computes parameters describing the network topology and displays their distributions in diagrams.
Reference: Assenov Y, Ramirez F, Schelhorn SE, Lengauer T, & Albrecht M: Computing topological parameters of biological networks. Bioinformatics 2008 24(2):282-284.
Contact
OpenPrimeR

openPrimeR is an R package providing methods for designing, evaluating, and comparing primer sets for multiplex polymerase chain reaction (PCR). The package provides a primer design function that generates novel primer setes by solving a set cover problem such that the number of covered template sequences is maximized with the smallest possible set of primers. Moreover, existing primer sets can be evaluated according to their coverage and their fulfillment of constraints on the PCR-relevant physicochemical properties. For PCR tasks for which multiple possible primer sets exist, openPrimeR can facilitate the selection of the most suitable set by performing comparative analyses. The R package includes a Shiny application that provides a comprehensive and intuitive user interface for the core functionalites of the package.
Contact
Recco

Recco analyzes alignments of sequences that evolved subject to recombination and mutation. The analysis provides evidence as to whether a dataset contains recombination, which sequence is a recombinant and where the recombination breakpoints are. The analysis is based on explaining one sequence with all other sequences in the alignment using mutation and recombination. A parametric analysis of the parameter alpha, which weights recombination cost against mutation cost, yields additional information as to which sequence might be recombinant.
Reference: Maydt, J.; Lengauer, T., Recco: recombination analysis using cost optimization. Bioinformatics 2006, 22 (9), 1064-71.
Contact
RINalyzer
RINalyzer is a Java plugin for Cytoscape, a free open-source software platform for visualization and analysis of biomolecular networks. This plugin allows the simultaneous visualization and interactive analysis of residue interaction networks (RINs) together with the corresponding 3D protein structures displayed in UCSF Chimera. It also provides a comprehensive set of topological centrality measures to gain additional insights into the structural and functional role of interacting residues.
Reference: Doncheva, N.T., Klein, K., Domingues, F.S., Albrecht, M. (2011): Analyzing and visualizing residue networks of protein structures. Trends in Biochemical Sciences, 36(4): 179-182.
Contact
RnBeads
RnBeads is an R package for comprehensive analysis of DNA methylation data obtained with any experimental protocol that provides single-CpG resolution, including Infinium 450K microarray and bisulfite sequencing protocols, but also MeDIP-seq and MBD-seq once the data have been preprocessed with DNA methylation inference software. RnBeads implements an analysis workflow that is significantly more comprehensive than those of other existing tools. It documents its results in a highly annotated and readable hypertext report, and it scales to the large sample sizes that are becoming the norm for DNA methylation analysis in human cohorts.
Contact
ROCR

ROC graphs, sensitivity/specificity curves, lift charts, and precision/recall plots are popular examples of trade-off visualizations for specific pairs of performance measures. ROCR is a flexible tool for creating cutoff-parametrized 2D performance curves by freely combining two from over 25 performance measures (new performance measures can be added using a standard interface). Curves from different cross-validation or bootstrapping runs can be averaged by different methods, and standard deviations, standard errors or box plots can be used to visualize the variability across the runs. The parametrization can be visualized by printing cutoff values at the corresponding curve positions, or by coloring the curve according to cutoff. All components of a performance plot can be quickly adjusted using a flexible parameter dispatching mechanism. Despite its flexibility, ROCR is easy to use, with only three commands and reasonable default values for all optional parameters.
Reference: Sing, T., et al., ROCR: visualizing classifier performance in R. Bioinformatics, 2005. 21(20): p. 3940-1.
Contact
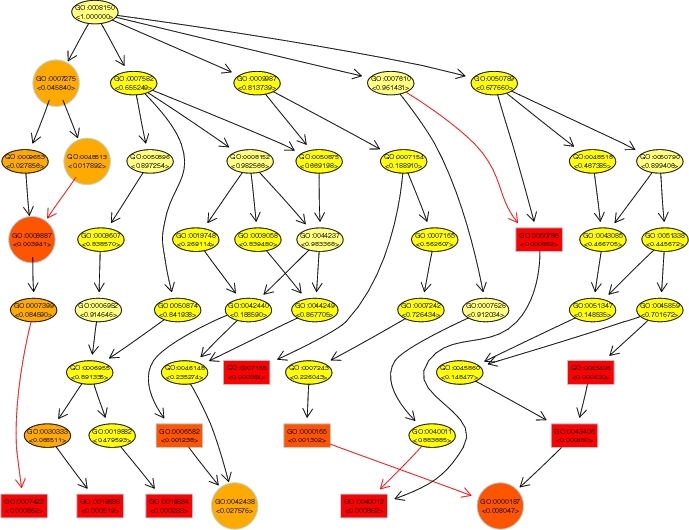
topGO
topGO (topology-based Gene Ontology scoring) is a software package for calculating the significance of biological terms from gene expression data. It implements various standard and advanced new algorithms for determining the relevance of Gene Ontology groups from microarrays. A specific feature of the advanced algorithms is the exploitation of the hierarchical graph structure of the GO annotation for coping with the large number of GO groups. Often, related biological terms are scored with a similar statistical significance. Dependencies between GO terms can be de-correlated by accounting for the neighborhood of a GO node when calculating its significance. The new algorithms better detect significant GO terms from gene expression data. |